Case study · river flood risk study, Staffordshire

Hamstall Ridware: keeping a village dry below a reservoir

A village below a large water-supply reservoir flooded in February 2020. The hydrology was entirely my work. I built the 1D–2D hydraulic model jointly with an Environment Agency modelling colleague. I checked the model against residents’ own flood records, counted their mental-health harm alongside damage to homes and presented the results to the village. The protection delivered was a bund the farmers built.

Role
Hydrologist and hydraulic modeller
Client
Environment Agency
Period
2020–25
Estimated value
est. US$100k (if contracted externally)
Status
Delivered: a bund built by the farmers

Environment Agency and council references available on request.

Design standard: a flood with a 1% chance in any year (1% AEP), plus the 2080s climate allowance (+29% flow)

Real model output: the 2022 Flood Modeller 2D run (1% AEP flood + 29% climate allowance, 6 m grid; 149 ha at its peak), replayed from the model’s arrival times, not to time scale.

Animated map: in the 2022 model of a 1% AEP flood with a 29% climate allowance, water spreads over 79 hours to cover 149 hectares of the River Blithe and Trent floodplain at Hamstall Ridware.

catchment, about three-quarters of it above Blithfield Reservoir
163km²
pooled 1% AEP flow to the village, against 30.0 from the gauge record alone
44.6m³/s
grid of the linked 1D–2D model, built on 1 m LiDAR
5m
buildings flooded from the 1% AEP flood to the same flood with +29% climate allowance
14 → 21

Plan and appraise

The same flood, two ways to change it

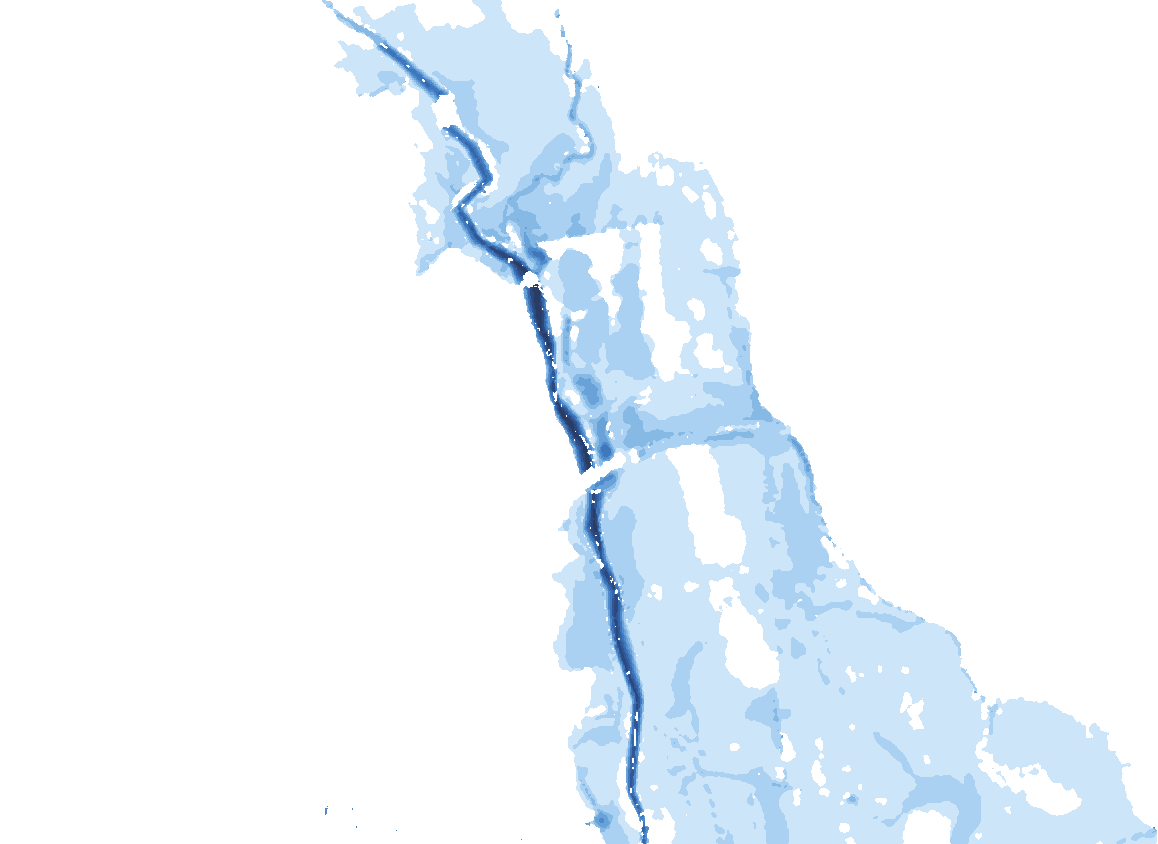
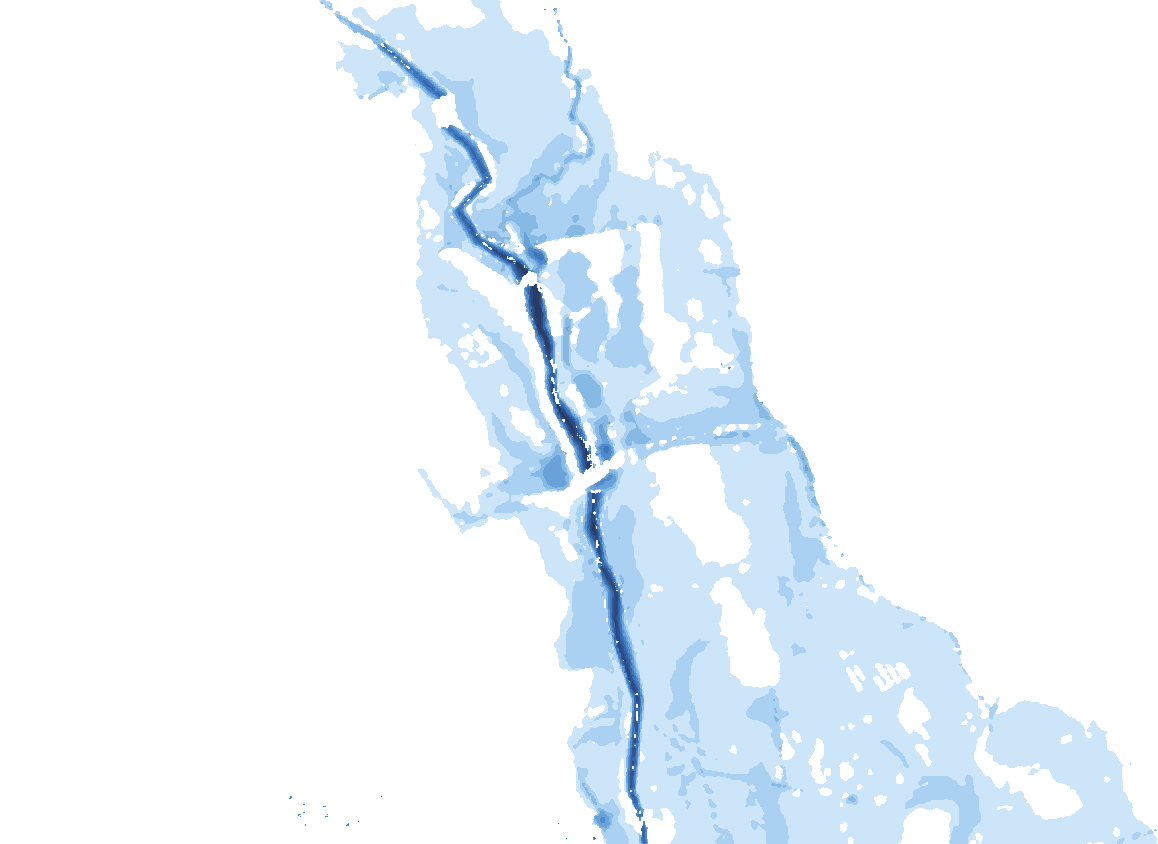
What would stop the village flooding? The 2024 model tested two options against today’s situation, for a 1-in-100-year flood (1% AEP) with a 15% climate allowance. Drag the handle, or use the arrow keys, to compare them.

Fig. 1

1% AEP flood with +15% climate allowance: baseline against two options

Compare the baseline with
Basemap: Hamstall Ridware, the River Blithe and the surrounding farmland (OpenStreetMap) Baseline modelled flood depths: water crosses the right bank into the village. Modelled flood depths with the right-bank defence raised: the village stays dry and water spreads across the farmland opposite. Baseline Raised defence

Modelled depth, m

0>2.5

Change against the baseline (right of the handle)

  • No longer wet
  • Newly wet
  • Deeper
  • Shallower

In the baseline, water crosses the right bank into the village. Opening the second bridge arch gives no benefit upstream. The raised defence keeps the village dry and holds the water on farmland. Event: 1% AEP + 15% climate allowance.

Sources

Flood depths: Environment Agency 2024 model, which I built jointly with an Environment Agency modelling colleague; depth classes recovered from the report maps. Basemap © OpenStreetMap contributors (flood colours removed, farm labels blurred).

From catchment to a farmers’ bund, in five steps

The whole study in five steps: the catchment, the hydrology, the model, the options and what was built. The detail behind each step follows.

Overview

Catchment → hydrology → 1D–2D model → options → outcome

Scroll through the five steps; in step 3, scrolling runs the flood hour by hour.Choose a step; in step 3, drag the hour slider to run the flood.

Four sub-catchments drain to the village

Schematic of the 163 km² catchment: the area upstream of Blithfield Reservoir (119.7 km²), Ash Brook (12.8 km²), Pur Brook (15.7 km²) and the intervening area to the village (14.5 km²).

Design inflow above the reservoir, 1% AEP (hybrid)

2022 Flood Modeller 2D run: 1% AEP flood + 29% climate allowance, 6 m grid

1% AEP + 15% climate allowance (2024 model): baseline and raised defence

Basemap: Hamstall Ridware, the River Blithe and the surrounding farmland (OpenStreetMap) Baseline modelled flood depths: water crosses the right bank into the village. Modelled flood depths with the right-bank defence raised: the village stays dry and the water spreads across the farmland opposite. Raised defence Baseline

Flood depths: Environment Agency 2024 model, built jointly by me and an Environment Agency modelling colleague. Basemap © OpenStreetMap contributors.

Benefit–cost ratio on one standard basis

My own self-initiated cost–benefit appraisal (not a formal Environment Agency submission): a simplified appraisal on a standard basis, using the damages from my 2022 study.

Step 1 of 5 · Catchment

A catchment below a reservoir

Three-quarters of the catchment drains through Blithfield Reservoir, and at high flows water goes round the village gauge, so its record misses the biggest floods. I split the catchment at the reservoir and routed the upstream flood through it.

163 km²catchment to the village, about 75% of it controlled by the reservoir

Step 2 of 5 · Hydrology

Three estimates, one design flow

I compared the gauge record with pooled statistics from similar catchments and the ReFH2 rainfall–runoff method, then built the design hydrographs from the most defensible parts of each: ReFH2 shapes scaled to pooled peaks, for each sub-catchment.

44.6 m³/spooled 1% AEP flow to the village, against 30.0 from the gauge record alone

Step 3 of 5 · 1D–2D model

A linked 1D–2D model, hour by hour

The river and its bridge are modelled in one dimension, the floodplain and village in two. The hydrology was entirely my work. I built the 1D–2D hydraulic model jointly with an Environment Agency modelling colleague. I checked it against residents’ records of the February 2020 flood. Keep scrolling to run the 2022 model through the event.

149 haflooded by hour 79 in the 2022 run (1% AEP flood with a 29% climate allowance)

Step 4 of 5 · Options

Two ways to change the flood

The 2024 model (Flood Modeller–TUFLOW, 5 m) tested opening the second bridge arch and raising the right-bank defence. Opening the arch gave no benefit upstream. The raised defence keeps the village dry and holds the water on farmland.

Village drywith the raised right-bank defence, for every event modelled up to 0.1% AEP

Step 5 of 5 · Outcome

A bund the farmers built

In my own cost–benefit appraisal (self-initiated, not a formal Environment Agency submission), on one standard basis, an earth bund on the defence line has by far the highest benefit–cost ratio of the options appraised. What was delivered was an earth bund built by the farmers, through partnership with landowners and the village.

4.6benefit–cost ratio of an earth bund (3.3–7.0 across unit rates), against 1.6 for a wall and 1.0 for an embankment

Sources

My flood estimation record v4 (2025); the Environment Agency 2024 model, built jointly by me and an Environment Agency modelling colleague; the 2022 Flood Modeller 2D run, rendered from its arrival-time and maximum-depth grids; my own self-initiated standard-basis appraisal (2026). Basemap © OpenStreetMap contributors.

Before the flood: understanding risk

A catchment below a reservoir, and a gauge that is bypassed in floods

Where the water comes from, and why the usual methods did not fit. Most of the catchment is controlled by a large reservoir, and the village gauge cannot measure the largest floods.

Show the catchment schematic
Fig. 2

The River Blithe to Hamstall Ridware, split into four sub-catchments

Schematic of the 163 km² catchment: the area upstream of Blithfield Reservoir (119.7 km²), Ash Brook (12.8 km²), Pur Brook (15.7 km²) and the intervening area to the village (14.5 km²), with model inflow points and the village gauge at the road bridge.

Each sub-catchment has its own design flood; the reservoir catchment’s flood is routed through Blithfield Reservoir before it joins the others.

Sources

Traced from my flood estimation record (2025). Schematic, not to survey accuracy.

Flood frequency at the gauge

How often do big floods happen here? The village gauge gives fifty years of each year’s highest flow (1959/60 to 2020/21), fitted with a Gumbel distribution, a standard curve for yearly maxima. Above the bypass flow the record flattens, because water goes round the weir rather than through it.

Show the chart: annual maximum flows at the gauge
Fig. 3

Annual maximum flows at gauge 28002 against the Gumbel reduced variate

Dots: annual maxima at Gringorten plotting positions; hover for the water year. Lines: Gumbel fit to the gauge record, and the pooled estimate for the full catchment.

Sources

Gauge data: NRFA station 28002 © UKCEH; Environment Agency. My analysis (2022, updated 2025).

Three estimates, one design flow

Three standard ways of estimating a rare flood gave different answers, so I combined the most defensible parts of each: the gauge record, pooled statistics from similar catchments (WINFAP) and the ReFH2 rainfall–runoff method.

Show the chart: peak flow by three methods
Fig. 4

Peak flow for the full catchment by three methods

Full-catchment (lumped) estimates, used as a check. The design flows are the final hybrid values for each sub-catchment, listed in the table.

Sources

My flood estimation record v4 (March 2025). Methods: Flood Estimation Handbook statistical (single site and pooled, WINFAP) and ReFH2.

Design hydrographs: how big, and when

A 2D model needs the whole flood, not just its peak. These are the inflows that drive the model, for each return period and with each climate allowance.

Show the chart: design inflow hydrographs
Fig. 5

Design inflow hydrographs, upstream of the reservoir and by sub-catchment

Climate-allowance lines are derived by scaling the base hydrograph by (1 + allowance), the way peak-flow allowances are applied; they are dashed and labelled “derived”. The upstream inflow is shown before routing through the reservoir.

Sources

ReFH2 and pooled statistical analysis, flood estimation record v4 (2025); sub-catchment series digitised from the December 2024 technical report (approximate).

Storage on the floodplain

Water that spreads onto the fields upstream of the village does not arrive at once. In the 2D model the floodplain lowers and delays the flood peak.

Fig. 6

Flow into and out of the 2D floodplain, 1% AEP + 29% (2022 model)

Approximate, digitised from the 2022 model output: a peak of about 34 m³/s in becomes about 19 m³/s out, some 31 hours later. The shaded gap is water held on the floodplain.

Sources

Flood Modeller 1D–2D model (2022), built jointly by me and an Environment Agency modelling colleague; values read from the model’s flow plot.

The linked 1D–2D model

A computer model shows where the water goes, field by field and street by street. The river channel and its bridge are modelled in one dimension; the floodplain and village in two. The hydrology was entirely my work. I built the 1D–2D hydraulic model jointly with an Environment Agency modelling colleague.

Show the model schematic
Fig. 7

Model schematic: 1D channel, 2D floodplain, boundaries and inflows

Schematic of the linked model: the 2D floodplain domain outlined around the village, the 1D river channel running through it to the River Trent, the arch bridge, the right-bank embankment as a 2D line, the upstream inflow and the downstream boundary on the River Trent.

Upstream inflow: routed reservoir outflow plus tributaries. Downstream boundary: a fixed level on the River Trent.

Sources

Model extent traced from the 2024 modelling report; roads and water © OpenStreetMap contributors. Schematic.

I build full 2D hydrodynamic models at 10–30 m resolution. I used TUFLOW and Flood Modeller 2D here; HEC-RAS 2D and SFINCS are other options for river and coastal work. At Hamstall the grid is finer, 5 m, because the decision turns on a single bank line beside a village.

Show the chart: the model against the community’s records
Fig. 8

Checked against the community’s records of the February 2020 flood

Homes reported flooded by residents in a community questionnaire, against homes flooded in the model, on three public roads (labelled generically). Hover for response notes.

Sources

Community flood questionnaire and the 2022 Flood Modeller model; February 2020 flood (gauge peak 20.8 m³/s).

Watch the flood develop, hour by hour
Fig. 9

Watch the flood develop: one modelled event, hour by hour

Cells wet by each hour, coloured by the deepest water they eventually reach. The faint area is the full extent at hour 79. Deep water to the south is the River Trent floodplain inside the model domain.

Sources

Event: 1% AEP + 29% climate allowance, March 2022 Flood Modeller 2D run (6 m grid). Rendered exactly from my raw time-of-first-flooding and maximum-depth grids; British National Grid 410000–412418 E, 317004–320088 N.

Learn and adapt: the future will differ from the past

Climate change, one allowance at a time

What changes as the climate warms? The 2024 model ran the 1-in-100-year flood (1% AEP) with three climate allowances, and a 0.1% AEP flood for context. Step through them to see how many buildings flood, and how deep.

Fig. 10

Buildings flooded and maximum depth at the buildings, by event

Buildings listed as flooded in the model, and the depth of water at them. The gauge shows the maximum depth at any building.

Sources

Environment Agency 2024 model (Flood Modeller–TUFLOW, 5 m), built jointly by me and an Environment Agency modelling colleague.

Plan and appraise

Options and cost–benefit

I also carried out my own cost–benefit appraisal of the options (a self-initiated appraisal, not a formal Environment Agency submission). It weighs what each defence would cost over 100 years against the flood damage it would avoid. All three options use one standard basis and the damages from my 2022 study.

Fig. 11

Three defence options on the same 910 m line, and the damages they avoid

Select an option for how it was appraised. All three options are on one standard basis, so their benefit–cost ratios can be compared directly. GBP, 2021–22 prices.

Sources

My own self-initiated standard-basis appraisal (2026), not a formal Environment Agency submission, using the event damages from my 2022 study, Environment Agency fluvial defence cost evidence (SC080039), FCERM discount rates and 60% optimism bias.

Deliver

What was built: a bund, by the farmers

The appraisal and the 2024 model both pointed to holding the line on the right bank. What was delivered was an earth bund built by the farmers, through partnership with landowners and the village.

On one consistent basis, the earth bund has by far the highest benefit–cost ratio of the options appraised: about 4.6, against 1.6 for the wall and 1.0 for the embankment. The bund row in Fig. 11 appraises an earth bund of that kind on the modelled defence line; the farmers’ bund itself has no recorded dimensions or cost, so that row describes the option, not the as-built bank.

How the evidence led to the bund

The modelling evidence did the work it should: it showed where water entered the village, what each option would change, and that a defence on the right-bank line was worth having. The solution was then delivered through partnership: the farmers built the bund themselves, working with landowners and the village, supported by the Environment Agency’s modelling evidence.
What this shows for river basin programmes

ADB’s Resilient River Basin Initiative looks at the modelling, monitoring, forecasting and decision-support tools that river basins depend on. Assessing any of them comes down to four questions. Here are Hamstall’s answers.

Show the four questions and Hamstall’s answers
QuestionAt Hamstall Ridware
What tools were used?The village gauge record; Flood Estimation Handbook statistical methods with WINFAP pooling and the ReFH2 rainfall–runoff model; routing through the reservoir; a linked Flood Modeller 1D and TUFLOW 2D model on 1 m LiDAR with a surveyed channel; Multi-Coloured Manual damages and a cost–benefit appraisal.
Were they fit for the decision?Not on their own. The gauge is bypassed in floods, so single-site statistics came out a third below pooled estimates. Splitting the catchment at the reservoir, reconciling three methods and checking the model against the community’s flood records made the evidence fit to choose between options.
What data and capacity did they need?LiDAR, a channel and structures survey, the reservoir operator’s data, residents’ records of a real flood, and a modeller able to build, run and document the chain for quality assurance.
How could they be strengthened?Measure high flows at the gauge, or rate a bypass-proof section; keep model runs and routing workbooks together as a maintained model; carry the 2024 results into an updated appraisal; and link modelled levels to a local flood-warning trigger.
Next: from a model to a funded, delivered, operated system About seven years across the flood risk management cycle Programme delivery, partnership funding, flood warning duty and the policy work around them. Finance, deliver, warn and respond

Environment Agency and council references available on request.

Credits

Credits: Environment Agency 2024 model (built jointly by me and an Environment Agency modelling colleague); basemap © OpenStreetMap contributors (flood colours removed, farm labels blurred); NRFA gauge 28002 data © UKCEH; Environment Agency LiDAR (Open Government Licence).

Property names and addresses are withheld; verification counts are grouped by public road.